Brine Shrimp Lab
Prelab:
1. List some abiotic factors in an ecosystem: rocks, dirt, clouds, temperature, pH
2. List some biotic factors in an ecosystem: trees, animals, plants, bacteria
3. Read the procedure, determine the independent variable and write a hypothesis to test in lab.
· Independent: Water Temperature
· Dependent: The shrimp population
· Hypothesis: If the water temperature is increased in certain quadrants than there will be a smaller shrimp population in the heated quadrants.
Hypothesis:
If the water temperature is raised in certain quadrants than the shrimp population will decrease in the heated quadrants because the shrimp aren’t adapted to warm water.
· Independent Variable: Water temperature
· Dependent Variable: Shrimp population
· Controlled Variables: Same lamp, Petri dish, species of brine shrimp
· Control Group: Trials done without the black paper covering certain quadrants
· Experimental Group: Trials done with the black paper that heat up water temperature.
Problem:
What is the prime environment that brine shrimp prefer to live in?
Materials
· Petri dish
· Brine Shrimp Solution
· Black paper
· Lamp
· Marker
Procedure
1. Get two Petri dishes: one for the experimental, and one for the control.
2. Divide each Petri dish into four equal quadrants and label each quadrant 1-4.
3. Add 2 mL of the brine shrimp solution to each Petri dish.
4. Cover one of the Petri dishes with black construction paper so that two of the four quadrants are covered. Record which quadrant was covered.
5. Do not cover the second Petri dish with any paper; it will be used as a control.
6. Record the temperature and shrimp population of each quadrant.
7. Allow the Petri dish to sit under a lamp for 30 minutes.
8. After 30 minutes, record the temperature and shrimp population of each quadrant.
Observations
· Shrimp move very quickly between making it hard to count.
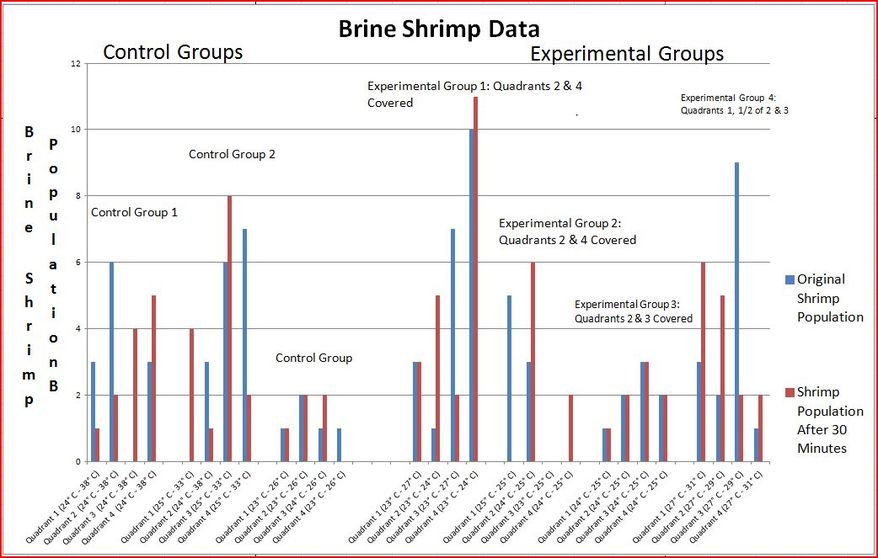
· In general the data showed the shrimp tend to prefer the cooler temperatures under the black paper. After the 30 minutes, there was a trend of shrimp leaving the quadrants that were heated by the lamp, and relocating to the quadrants that were covered by the paper. Some shrimp still were found in quadrants that were heated by the lamp, but the majority of the shrimp were in the quadrants that the paper covered. The control group yielded basically random results. There wasn't any visible trend that showed any quadrant had a greater shrimp population.
Data Table: See Below
Graphs: See Below
Conclusions Specific to Lab
1. What temperature does brine shrimp appear to prefer? Support your answer.
According to the results, the brine shrimp appear to prefer slightly colder temperatures. Light Group 1 most clearly expresses this trend. The quadrants with the greatest shrimp populations were quadrants 4 and, which happened to be 3 degrees colder (24° C) than the quadrants 1 and 3 (27° C) Quadrant 2 also started with only a single shrimp. After 30 minutes, the population increased exponentially with five shrimp being present. Quadrant 3, which was heated up 3 degrees, lost the majority of its shrimp going from seven original shrimp to two shrimp.
2. What light level does brine shrimp appear to prefer? Support your answer.
The brine shrimp appear to prefer shaded areas. Light Group 2 presented the clearest trend of the light level brine shrimp prefer. Quadrants 2 and 4 were covered with the black paper, and after 30 minutes, contained the entire shrimp population. Quadrants 1 and 3 didn’t have a single shrimp after the 30 minute time span. Quadrant 1 even began with the most brine shrimp. Light Group 1 also presented similar data. The quadrants with the greatest concentration of shrimp were both covered with the black sheets of paper.
3. Do the brine shrimp appear to be attracted to the light, temperature, or both? Support your answer.
I think the brine shrimp appear to be attracted away from the light. Light Group 2 had each quadrant the exact same temperature after the 30
minute time span; however, the shrimp still concentrated under the shaded quadrants. Light Group 3 also had each quadrant the same temperature at the end of the 30 minute time span. The shrimp, like in Light Group 2, had the greatest concentration under the shaded quadrants.
4. Did you have outliers that moved to an area of the plate that others did not prefer? Explain this result.
Yes, many of the shrimp were outliers in Light Group’s 1 and 3. In Light Group 1, most of the shrimp went to quadrant’s 2 and 4 because they were shaded and a cooler temperature; however, five out of the twenty-one shrimp ended up in quadrant 1 and 3. Quadrant 3 had similar outliers. Most of the shrimp population was in the covered quadrants; however, there still was a couple shrimp that were at the quadrants that were exposed to the open light.
5. How can this be applied to other organisms in aquatic ecosystems? Answer the question in a well-developed paragraph.
This experiment shows that aquatic ecosystems with more shaded areas have greater populations of brine shrimp than ecosystems in direct sunlight. If the presence of organisms such as brine shrimp is increased in shaded areas of aquatic ecosystems, than the presence predators and other organisms that feed on brine shrimp are going to increase. Organisms are going to be the most concentrated wherever the greatest amount of food is available. Predators are most likely going to be found in greater concentrations wherever there food is easiest to obtain.
General Conclusion:
The results ended up supporting the hypothesis. The hypothesis was that shrimp would prefer the cooler water instead of the heated water, which overall, is generally what the data supported. The shrimp seemed to generally concentrate in the areas that were covered by paper which made the water temperature slightly cooler. Even though the results supported the hypothesis, the results were still surprising. The areas that were covered by the black paper had a colder temperature even though it was predicted the black paper would end up with warmer water because the paper absorbs heat. After researching the brine shrimp, the results are also very surprising, because brine shrimp traditionally thrive in extremely warm, salty water which doesn’t exactly match the results of the lab.
The data ended up being very difficult to interpret. One major source of error is that the even though the temperature was the independent variable of the lab, the temperature was the same in each quadrant in Light Group 2 and 3. This makes the data almost completely irrelevant because it’s impossible to say if the shrimp liked a quadrant more because of the temperature if all the quadrants were the same temperature. Light Group 4 was also a source of error. The concept of covering only half of the quadrant makes the data unreadable. Without knowing which side the shrimp were on, Light Group 4’s data was unusable. There were also three control groups done in this experiment. The experiment would have yielded much more usable data if it only had one or two controls at most, and designated the last control to another experimental group to have more accurate data.
This experiment data’s shows that brine shrimp prefer to live in slightly cooler temperatures. If brine shrimp prefer to live in cooler temperatures, other organisms are also going to prefer to live in cooler temperatures to feed of the brine shrimp. With the globally increasing temperatures, this puts the aquatic ecosystems at risk. The global increase in temperature is raising the temperatures of the aquatic ecosystems. Brine shrimp’s ideal environment of cooler temperatures is being destroyed leaving the brine shrimp with no place to go. This makes the population of brine shrimp decrease, which in turn, upsets the population of other organisms that feed of the brine shrimp. This disturbance in aquatic ecosystem is not only limited to brine shrimp. Many species of animals that have ideal water temperature ecosystems are having their habitats destroyed by global climate change. This is a very serious issue that given time, will not only disrupt aquatic ecosystems for shrimp and local wildlife, but limit what kind aquatic resources are available for humans to use as well.
Works Cited
"Aquatic Ecosystem." Wikipedia. Wikimedia
Foundation, 29 Sept. 2012. Web. 30 Sept. 2012. http://en.wikipedia.org/wiki/Aquatic_ecosystem.
"How to Raise Brine Shrimp." WikiHow.
N.p., n.d. Web. 30 Sept. 2012. http://www.wikihow.com/Raise-Brine-Shrimp.
1. List some abiotic factors in an ecosystem: rocks, dirt, clouds, temperature, pH
2. List some biotic factors in an ecosystem: trees, animals, plants, bacteria
3. Read the procedure, determine the independent variable and write a hypothesis to test in lab.
· Independent: Water Temperature
· Dependent: The shrimp population
· Hypothesis: If the water temperature is increased in certain quadrants than there will be a smaller shrimp population in the heated quadrants.
Hypothesis:
If the water temperature is raised in certain quadrants than the shrimp population will decrease in the heated quadrants because the shrimp aren’t adapted to warm water.
· Independent Variable: Water temperature
· Dependent Variable: Shrimp population
· Controlled Variables: Same lamp, Petri dish, species of brine shrimp
· Control Group: Trials done without the black paper covering certain quadrants
· Experimental Group: Trials done with the black paper that heat up water temperature.
Problem:
What is the prime environment that brine shrimp prefer to live in?
Materials
· Petri dish
· Brine Shrimp Solution
· Black paper
· Lamp
· Marker
Procedure
1. Get two Petri dishes: one for the experimental, and one for the control.
2. Divide each Petri dish into four equal quadrants and label each quadrant 1-4.
3. Add 2 mL of the brine shrimp solution to each Petri dish.
4. Cover one of the Petri dishes with black construction paper so that two of the four quadrants are covered. Record which quadrant was covered.
5. Do not cover the second Petri dish with any paper; it will be used as a control.
6. Record the temperature and shrimp population of each quadrant.
7. Allow the Petri dish to sit under a lamp for 30 minutes.
8. After 30 minutes, record the temperature and shrimp population of each quadrant.
Observations
· Shrimp move very quickly between making it hard to count.
· In general the data showed the shrimp tend to prefer the cooler temperatures under the black paper. After the 30 minutes, there was a trend of shrimp leaving the quadrants that were heated by the lamp, and relocating to the quadrants that were covered by the paper. Some shrimp still were found in quadrants that were heated by the lamp, but the majority of the shrimp were in the quadrants that the paper covered. The control group yielded basically random results. There wasn't any visible trend that showed any quadrant had a greater shrimp population.
Data Table: See Below
Graphs: See Below
Conclusions Specific to Lab
1. What temperature does brine shrimp appear to prefer? Support your answer.
According to the results, the brine shrimp appear to prefer slightly colder temperatures. Light Group 1 most clearly expresses this trend. The quadrants with the greatest shrimp populations were quadrants 4 and, which happened to be 3 degrees colder (24° C) than the quadrants 1 and 3 (27° C) Quadrant 2 also started with only a single shrimp. After 30 minutes, the population increased exponentially with five shrimp being present. Quadrant 3, which was heated up 3 degrees, lost the majority of its shrimp going from seven original shrimp to two shrimp.
2. What light level does brine shrimp appear to prefer? Support your answer.
The brine shrimp appear to prefer shaded areas. Light Group 2 presented the clearest trend of the light level brine shrimp prefer. Quadrants 2 and 4 were covered with the black paper, and after 30 minutes, contained the entire shrimp population. Quadrants 1 and 3 didn’t have a single shrimp after the 30 minute time span. Quadrant 1 even began with the most brine shrimp. Light Group 1 also presented similar data. The quadrants with the greatest concentration of shrimp were both covered with the black sheets of paper.
3. Do the brine shrimp appear to be attracted to the light, temperature, or both? Support your answer.
I think the brine shrimp appear to be attracted away from the light. Light Group 2 had each quadrant the exact same temperature after the 30
minute time span; however, the shrimp still concentrated under the shaded quadrants. Light Group 3 also had each quadrant the same temperature at the end of the 30 minute time span. The shrimp, like in Light Group 2, had the greatest concentration under the shaded quadrants.
4. Did you have outliers that moved to an area of the plate that others did not prefer? Explain this result.
Yes, many of the shrimp were outliers in Light Group’s 1 and 3. In Light Group 1, most of the shrimp went to quadrant’s 2 and 4 because they were shaded and a cooler temperature; however, five out of the twenty-one shrimp ended up in quadrant 1 and 3. Quadrant 3 had similar outliers. Most of the shrimp population was in the covered quadrants; however, there still was a couple shrimp that were at the quadrants that were exposed to the open light.
5. How can this be applied to other organisms in aquatic ecosystems? Answer the question in a well-developed paragraph.
This experiment shows that aquatic ecosystems with more shaded areas have greater populations of brine shrimp than ecosystems in direct sunlight. If the presence of organisms such as brine shrimp is increased in shaded areas of aquatic ecosystems, than the presence predators and other organisms that feed on brine shrimp are going to increase. Organisms are going to be the most concentrated wherever the greatest amount of food is available. Predators are most likely going to be found in greater concentrations wherever there food is easiest to obtain.
General Conclusion:
The results ended up supporting the hypothesis. The hypothesis was that shrimp would prefer the cooler water instead of the heated water, which overall, is generally what the data supported. The shrimp seemed to generally concentrate in the areas that were covered by paper which made the water temperature slightly cooler. Even though the results supported the hypothesis, the results were still surprising. The areas that were covered by the black paper had a colder temperature even though it was predicted the black paper would end up with warmer water because the paper absorbs heat. After researching the brine shrimp, the results are also very surprising, because brine shrimp traditionally thrive in extremely warm, salty water which doesn’t exactly match the results of the lab.
The data ended up being very difficult to interpret. One major source of error is that the even though the temperature was the independent variable of the lab, the temperature was the same in each quadrant in Light Group 2 and 3. This makes the data almost completely irrelevant because it’s impossible to say if the shrimp liked a quadrant more because of the temperature if all the quadrants were the same temperature. Light Group 4 was also a source of error. The concept of covering only half of the quadrant makes the data unreadable. Without knowing which side the shrimp were on, Light Group 4’s data was unusable. There were also three control groups done in this experiment. The experiment would have yielded much more usable data if it only had one or two controls at most, and designated the last control to another experimental group to have more accurate data.
This experiment data’s shows that brine shrimp prefer to live in slightly cooler temperatures. If brine shrimp prefer to live in cooler temperatures, other organisms are also going to prefer to live in cooler temperatures to feed of the brine shrimp. With the globally increasing temperatures, this puts the aquatic ecosystems at risk. The global increase in temperature is raising the temperatures of the aquatic ecosystems. Brine shrimp’s ideal environment of cooler temperatures is being destroyed leaving the brine shrimp with no place to go. This makes the population of brine shrimp decrease, which in turn, upsets the population of other organisms that feed of the brine shrimp. This disturbance in aquatic ecosystem is not only limited to brine shrimp. Many species of animals that have ideal water temperature ecosystems are having their habitats destroyed by global climate change. This is a very serious issue that given time, will not only disrupt aquatic ecosystems for shrimp and local wildlife, but limit what kind aquatic resources are available for humans to use as well.
Works Cited
"Aquatic Ecosystem." Wikipedia. Wikimedia
Foundation, 29 Sept. 2012. Web. 30 Sept. 2012. http://en.wikipedia.org/wiki/Aquatic_ecosystem.
"How to Raise Brine Shrimp." WikiHow.
N.p., n.d. Web. 30 Sept. 2012. http://www.wikihow.com/Raise-Brine-Shrimp.
Brine Shrimp: Control Group
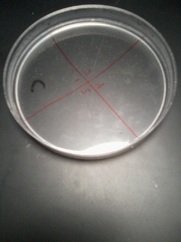
Picture of the Control Group 2. The water temperature was the same in all four quadrants.
Brine Shrimp Lab: Data Tables
| brine_shrimp_lab_data.docx |
Brine Shrimp Data