Catch and Release Lab
Pre-lab Questions
1. What are the variables in this experiment?
The independent variable is the catch size and the number of catches taken. The dependent variable is the accuracy of the population size. The controlled variables are the size of the fish and bag.
2. Write the problem in the form of a question.
What is the accuracy of using tagged fish to determine population size?
3. Create a hypothesis as to which variables will yield the most accurate estimate of the population's size.
If different catch sizes and number of catches are taken than the largest catch size and catch taken will have the greatest accuracy of determining the population size.
Hypothesis:
If different catch sizes and number of catches are taken than the largest catch size and catch taken will have the greatest accuracy of determining the population size.
· Independent: Catch size and number of catches taken
· Dependent: the accuracy of the population size
· Control: N/A
· Controlled: The bag size and size of the fish
· Experimental Group: the different catch sizes and number of catches taken
Problem:
What is the accuracy of using tagged fish to determine population size?
Materials:
· Paper Bag
· Red Beads
· White Beads
· Pencil
· Paper
· Calculator
Procedure:
1. Receive assigned sample catch and replace the respective amount of red beads from the bag with white “tagged” beads. Record the original number tagged into the table.
2. Shake the bag and mix the “tagged” beads with the original beads. Without looking into the bag, grab a handful of beads and record the total amount and the amount of “tagged” fish.
3. Repeat this for the total of the assigned catch size.
4. Calculate the percent tagged for each catch and average the column.
5. Calculate the estimated population size by dividing the number tagged by the mean of the sample percentages.
6. Count the actual population.
7. Calculate the percentage error between the estimated population and the actual population.
8. Record the data into the class set.
Observations:
· The group that had 10 tagged fish and 10 samples had the least percentage of error at 9%.
· The group with 10 tagged fish and 20 samples had the greatest percentage of error at 57%.
· The group with 10 tagged fish and 20 samples was done by two groups, one group had only a 16.25 percent error where as the other group had a vastly different 57 percent error.
Analysis
As you are writing your formal lab report, consider the following questions as part of your discussion:
1. What could cause the population size estimate to be different from the actual population size?
Estimates are never going to be exactly the same as the actual population for a number of factors. For one, it’s impossible to be able to count every single individual of the population so the two numbers are naturally going to be different. Another reason is that when the tagged population is caught, if by random chance you get many of the tagged species in one catch or none at all it significantly changes the estimate.
2. How can the size of your catch sample compared to the actual size of the population affect population estimate?
From the experiment, it appears the smaller the sample, the greater the percentage of error is. This is most likely because when you are have a smaller sample size, there is much larger margin of error that you could not catch a tagged fish which throws off the results. Also, when you have a greater catch sample, more of the population is being represented.
3. How can the number of samples (or catches) affect the results?
From the data, it appears that the greater the number of catches the greater the percentage of error. However, this notion also appears to be inaccurate as one of the lowest percentages of error was found with the large number of samples. The high percentage of error could be due to not pulling a tagged fish in many of the trials. Not pulling a tagged fish significantly alters the results. I’d think that the greater sample size would actually give a much more accurate figure. The more samples that are done, you have a more accurate figure because you have a better average. This is why in most experiments there is never just one trial.
4. Does this method appear to be an effective way to assess population size? Why or why not?
No, this does not appear to be an effective way to assess population size at all. The data collected shows absolutely no correlation. For every combination of sample size and number of samples one group would turn in their data with a high percentage of error, but then another group with the same combination would have a low percentage of error. I believe this is due to just random chance when picking the tagged fish. If one group happens to not pull a tagged fish a few times their data is going to be much different than a group that pulled a tagged fish every time.
5. If you were predicting a large population (like an actual ocean fishery) would your percent error be very large?
Yes, I think the percent error would be very large. An ocean fishery has so many fish that the tagged fish are very easy to not be caught and therefore creating a large percent error.
6. What concerns should a biologist have about a species’ habits before (s)he uses this method to approximate the size of a population?
One concern is the species behavior with other individuals of the same species. Many species either like to group together such as fish, or others isolate themselves off and do not interact with other individuals of their same species. This could make it very difficult to even find the species and catch a large sample species. Another habit that would be difficult to tag is species that avoid human confrontation. Many species of apes will flee humans and that makes it very difficult to tag, and get any sample size at all.
Conclusion
According to the experiment, my hypothesis turned out to be incorrect. I thought that a greater catch size and more samples would have a more accurate percentage of error because it’s sampling more of the population and there are more trials to get a more accurate figure. The experiments results proved that there is actually no correlation between the number sampled and the number of samples. Every combination of catch sizes and number of trials all yielded some high and low percentages of error. This is because this experiment is so easily affected by chance of not catching any tagged fish. If you happen to not catch any tagged species, the percentage of error is significantly changed and the data is much less accurate.
To make this experiment better, more data is crucial. As the experiment was currently preformed, multiple groups only did a couple of the same combinations of catches and trials. This made the data extremely hard to read because the few combinations that multiple groups did had almost no correlation what so ever. This made the outliers of the data very difficult to determine because virtually any combination could be an outlier without having more data. In order to solve this problem, the same combination should have been tested multiple times to get a more accurate figure. This could have shown a correlation in the data, because as it was currently done, no correlation was evident.
The result of this experiment makes current populations estimates very questionable. It was evident from this experiment that using tagged species to determine population size is extremely inaccurate with one trial having a staggering 57 percent error. If this is the case, all the population estimates of animals such as endangered species make these estimates much less credible. For example, the population of pandas, an endangered species. Pandas are very illusive in nature so just getting tagged species is a difficult task. Then these tagged species can, by chance, avoid being caught in the trials and thus making the population of pandas seem much lower than they actually are.
Works Cited
"Endangered Species." Endangered Species - EndangeredSpecie.com. N.p., n.d. Web. 01 Nov. 2012. <http://www.endangeredspecie.com/>.
Class Data
| results_from_all_groups.docx |
Number of Tagged Graph
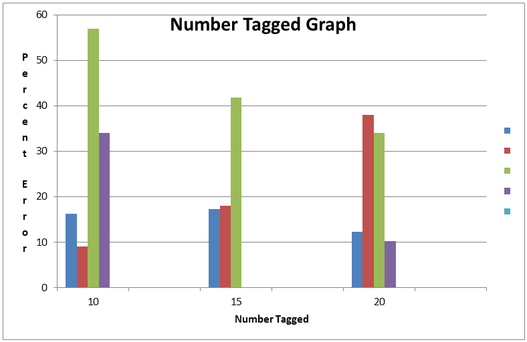
The percentage error compared to the amount of tagged species.
Number of Samples Graph
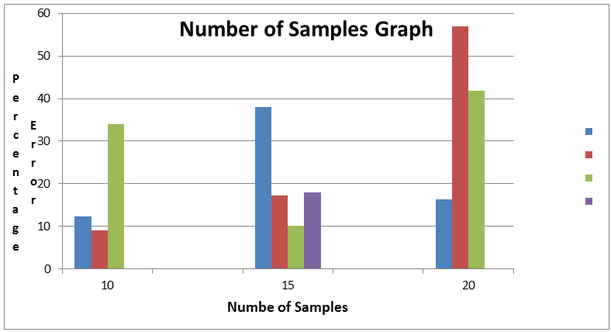
The percentage area compared to the number of samples.
Picture of Lab
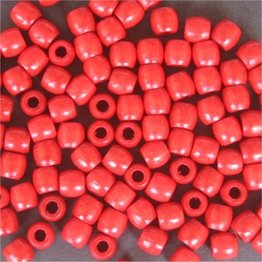
The original population of untagged beads.
