Leaf Litter Lab
Prelab Questions:
1. Why would we want to rate the amount of biodiversity in a location?
The amount of biodiversity is an indicator of other factors such as how healthy the environment is. The greater the amount of biodiversity is an indicator the environment is healthy and is able to support a larger amount of life.
2. Examine the charts below and calculate the diversity indices for the three samples:
Sample 1: Simpson’s Index: .18; Simpson’s Index of Biodiversity: .88; Simpson’s Reciprocal Index: 5.55
Sample 2: Simpson’s Index: .25; Simpson’s Index of Biodiversity: .75; Simpson’s Reciprocal Index: 4
Sample 3: Simpson’s Index: .92; Simpson’s Index of Biodiversity: .08; Simpson’s Reciprocal Index: 1.09
3. Use the results from the previous question to describe the biodiversity of each sample.
Sample 1 had the greatest biodiversity of each sample. All three samples had the same richness; however, sample 1 had the greatest evenness with each species having 10. Sample 2 had the second greatest biodiversity. Sample 2 had the same richness; however, species 1 and 2 had the clear majority compared to the other species found in sample 2. Sample 3 had the lowest biodiversity. Species 1 was the clear majority with the other species lacking in population, making the environment not very diverse.
Hypothesis:
If samples of leaf litter are taken from trail than they will have a high biodiversity density because the ecosystem is healthy and has many organisms.
· Independent Variable: Location leaf litter was taken
· Dependent Variable: Biodiversity of the leaf litter.
· Controlled Variables: The amount of leaf litter collected, the size of the container holding the leaf litter.
· Control Group: No control group
· Experimental Group: The leaf litter collected at different places on the trail.
Problem: What is the biodiversity of the organisms found in the trail's ecosystem?
Materials:
· Leaf Litter
· Compound Microscope
· Alcohol
· Zip-loc baggie
· Empty One Gallon Container
· Lamp Soil· Beaker
Procedure
1. Collect a sample of leaf litter or soil on the trail and put it into a Zip-loc baggie.
2. Examine the sample and classify what you see the layer is composed of.
3. Place your sample into the empty gallon container under the light source. Place a small beaker of the alcohol solution under the funnel. Small organisms should travel down the funnel and into the funnel to be collected.
4. After a few days, collect your beaker and examine the organisms you have collected under the microscopes. You will need to calculate the number of each species you have, and identify them. Use the Identification pages to name each species.
5. Use the information to calculate the diversity indices for your sample.
Observations:
Location: Wake Forest, North Carolina
Type of Community: Urban
Date: Thrusday, September 20, 2012
Weather Descrpition: Warm, Humid, Sunny, clear skies
Air Temperture: 76°
Soil Temperture: N/A
Relative Humidity: 72
Time: 11:15 - 12:00 P.M.
· Sample 3 was in the shade, but yielded no organisms; however, Sample 6 was in the same environment and ended up with the greatest amount of organism, the only difference was Sample 3 was soil, and Sample 6 was leaf litter.
· Sample 6 which were found in the shade had an overwhelming majority of the predaceous mite with 13 individual mites found in the leaf litter.
· Sample 1 contained organism that no other sample contained: an ant and pauropod.
· The psocids were only found in samples that were in the sunny spots.
· The leaf litter samples had much more organisms than the soil samples.
Calculations:
Simpson’s Index: .233
Simpson’s Index of Diversity: .767
Simpson’s Reciprocal Index: 4.29
Questions
1. What are two reasons the organisms move away from the light down the funnel? What does this indicate about the organisms?
One reason the organisms move away from the light is that the light imitates the sun which makes the organisms naturally move away from the light. In their natural habitat, these organisms wouldn’t try to move toward the sun, so the organisms move away from the light. Another reason is that the light creates a lot of heat the top of the funnel. The bugs naturally travel deeper into the funnel because it is much cooler and damp which the organisms prefer. This indicates that the organisms prefer to live in much cooler, damper climates.
2. Summarize whether you think the biodiversity of this litter is high or low density. If low, try to give some reasons why this might be.
I think overall the biodiversity of this litter was of a high density. The litter was very rich with different species of organisms. A total of eleven different species were present in the samples of leaf litter. The leaf litter also had somewhat decent evenness. Each species had a relatively close amount of individuals of 1 - 2, with the termite and psocid having 5 and 4, respectively. The precaceous mite was an outlier in the data with a very large number of 17. A total of 13 of the 17 mites only appeared in one sample so the data still trends towards a high density biodiversity overall. The leaf litter had many species which were fairly equally in abundance, therefore, the leaf litter was had a high density. This is most likely because the ecosystem that the litter is from is very healthy. Nothing is causing a disturbance in biodiversity which is an indicator that the ecosystem is functioning properly.
3. Why would an environmental scientist need to make more than one measurement if he was calculating the biodiversity? How would you take samples of a large forest?
It’s very important for a scientist to take more than one measurement because it ensures that he gets an accurate measurement of the biodiversity. If you only take one sample, that one area could temporarily not have a lot of organisms for a variety of factors such as weather, predators, or just coincidence. For example, during this lab one of the samples ended up not yielding any organisms, but every other sample did. If that one sample without any organisms was the only sample taken, the area would appear to not be very diverse. It's also important to take different samples of different substances. Leaf litter should be collected as well as soil. Only collecting one would make the data much less accurate. The more samples taken would give a more accurate reading of the biodiversity of the forest.
General Conclusion
The results of the experiment did end up supporting my hypothesis. The data revealed that trail had a a very high biodiversity. The data had one outlier species of the precaceous mite, but other than that the data showed a high density biodiversity. The trail leaf litter’s biodiversity was high because the leaf litter had a large richness as well as evenness of abundance of species. The leaf litter had a high biodiversity because the trail ecosystem was healthy. The ecosystem is functioning properly and is able to support different species as well as supporting even populations of each of the species.
There were many sources of error throughout this experiment. One source of error is the fact small amount of data collected compared to the size of the area being measured. The general trail area that was measured is extremely large compared to the few samples that were taken. This makes the biodiversity calculated not really the most accurate figure of the biodiversity of the area. Another source of error is the location in which the leaf litter was collected. Most of the samples were collected relatively near the trail. This is an area heavily walked upon by humans compared to the other parts of the ecosystem which could alter the data and cause a less accurate result of the actual biodiversity.
Biodiversity is a very important indicator of the health of an ecosystem. Ecosystems all around the world from the Great Barrier Reefs to the Amazon Rain Forest are suffering from severe biodiversity loss from human activity. Humans, in the case of the tropical rain forests, are cutting down these forests and limiting the space the local wildlife has to live. This makes the ecosystem unable to support as much organisms which causes the biodiversity to go down. Biodiversity is also suffering from climate change, which is also an effect of humans. The global climate change is making ecosystems unlivable for many species of animals. These species of animals die off which allows animals with a greater range of tolerance to take over the ecosystem which creates a lower biodiversity.
Works Cited:
"Biodiversity." Global Issues. N.p., n.d. Web. 04 Oct. 2012. <http://www.globalissues.org/issue/169/biodiversity>.
Leaf Litter Data Table
Data table of the different species found in the leaf litter.
Leaf Litter Graph
Graph of the abudance of species in the leaf litter.
Leaf Litter Sample Data
Data table of the abudance of organisms from each individual sample taken.
Leaf Litter
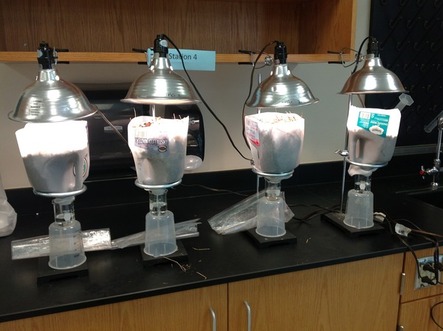
Set up of the lab litter collecting data.
