LD50 Lab
Hypothesis: If different salt solutions are added to radish plant seeds, than Beaker 3 with 6.25% of salt will have the greatest root growth and germinate the most seeds because it contains enough salt to help benefit the plant, but not too much that would hinder the growth.
· Independent: The different salt solutions added to the radish plant seeds.
· Dependent: The amount of seeds that germinated and root size.
· Control: Beaker 1 with no salt.
· Experimental: The beakers with the salt solutions added.
· Controlled: Same amount of seeds in each beaker, size of Petri dishes, total volume of liquid.
Problem: What concentration of salt causes the greatest amount of vegetation growth?
Materials:
· 6 Petri Dishes
· 60 Radish Seeds
· 12 Napkins
· Concentrated salt solution
· Water
· Graduated cylinder
Procedure
1. Use the graduated cylinders to prepare the different concentrations of salt solutions. Measure out the required amount of water and add the respective amount of salt solution to create the solution that will be added to the radish seeds.
2. Label the Petri dishes with the group number, dish number, and the percent concentration.
3. Cut out two strips of napkin that will fit into the Petri dish.
4. Moisten the napkins, then place one at the bottom of the dish, followed by the seeds, followed by the other napkin.
5. Pour the chemical solution into the respective Petri dishes.
6. Stack the seeds and wait for the results.
Conclusion:
1. What appears to be the LD50 for salt for radish seeds? Support your answer with data.
The LD50 appears to be the 12.5% concentration of salt solution. The data clearly shows that the concentration with greatest root growth is 12.5%, with the clear majority of 27.7 millimeters. This concentration also happens to be located right in the middle of the data, making more likely to be the LD50. The data shows a clear trend. The root length starts at 17.63 millimeters with the control and remains relatively steady only dropping to 14.01 millimeters when the salt solution is added. Once the solution reaches 12.5%, the data spikes to 27 millimeters, revealing the LD50. From there, the data shows slower and slower root length until it reaches its lowest length of 14.57 millimeters at 100% salt concentration.
2. Is your radicle data supported by your germination data? Support your answer with data.
Although the data shows a slight correlation, it is generally not supported by the germination data. The data shows the greatest amount of seeds germinated, contrary to what is to be expected, is not the LD50, but the control group with 0% concentration with an average of 9 out of the 10 seeds being germinated. Taking out the outlier of the control group, the germination shows a correlation of being the second highest amount germinated of around 7.5 out of 10 seeds germinated at the 12.5% and 25% salt concentrations, which is right where the projected LD50 was.
Conclusion
Looking back at the data, the hypothesis was not correct; however, it was close. It was initially predicted that the salt concentration that showed the most successful radish seed growth would be around 6.25%. The data showed that the greatest amount of root growth was 12.5% and the most seeds germinated were found in the control with 0% salt in the solution. The root growth was due to the LD50 being at 12.5% instead of 6.25%. The initial hypothesis, however, was very close to this estimate. The root growth did not match the hypothesis most likely because of outlier groups. A couple groups around 12.5% had a lot of their seeds not germinate; however, the majority of the groups had the majority to all of their seeds germinated. Since the data is an average, this made the results slightly deceiving why the greatest root growth didn’t also have the greatest amount of seeds germinated.
One of the greatest sources of error was the seeds as they were put in the Petri dish. Most of the seeds were put directly in between the two paper towels like the experiment called for; however, a couple seeds got loose and were not inside the paper towel. This appeared to be the reason why some of the seeds in concentrations in which had high root growth did not germinate and alter the lab data. If the seeds were more carefully put between the two paper towels, the experiment would have been more accurate. Another possible source of data is that the class data includes outliers from all groups. Many other groups in the class had data that did not support the general trend of the other groups. Because the data was an average, these outliers were included and made the data slightly deceiving. If a system was in place that could eliminate the outliers, the experiment would be much more accurate.
This experiment not only revealed how salt effects the growth of radish seeds, but the overall concept having thresholds. This concept can be clearly exhibited in fertilizers. Fertilizers enable plants to grow more productively by supplying it with nutrients and substances such as phosphates and nitrogen. The process of making fertilizer, however, can be very difficult as it is crucial to find the key amount of these nutrients for the plant to yield maximum growth. Another concept that is exhibited with this lab is toxins. Mercury is a toxin that is consumed by humans every day through the environment or contaminated foods such as fish. Mercury can be very toxic, or even fatal in high doses; however, at very low concentrations, it can be virtually harmless.
Works Cited
"Easy Seed Germination." Seed Germination Tips and Techniques. N.p., n.d. Web. 08 Nov. 2012. <http://www.megagro.com/seed-germination.htm>.
"Human Exposure." EPA. Environmental Protection Agency, n.d. Web. 08 Nov. 2012. <http://www.epa.gov/hg/exposure.htm>.
LD50 Data
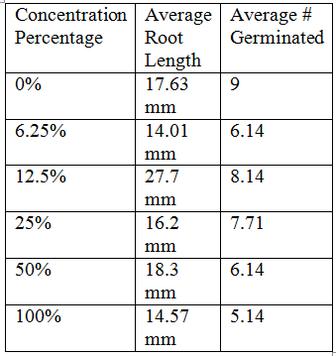
Chart showing the class's data of the average root length and the average number of seeds that germinated in respect to the concentration of the salt solutions.
LD50 Graph
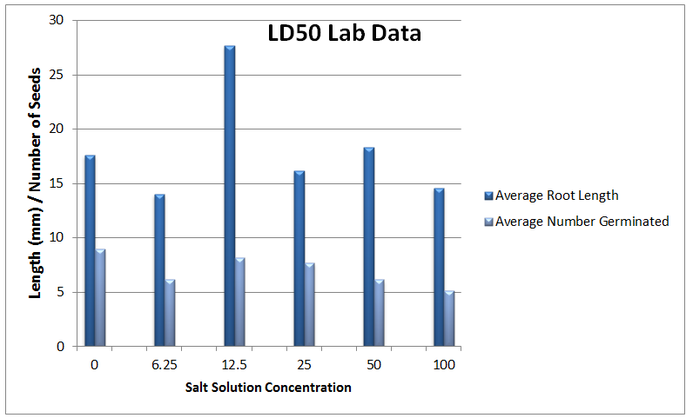
Graph showing the average root length and the number of seeds germinated in respect to the concentrated salt solutions.
Results
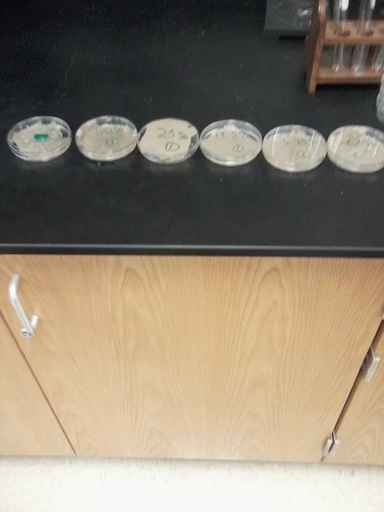
The set up of the different concentrations of salt solutions with radish seeds.
LD50
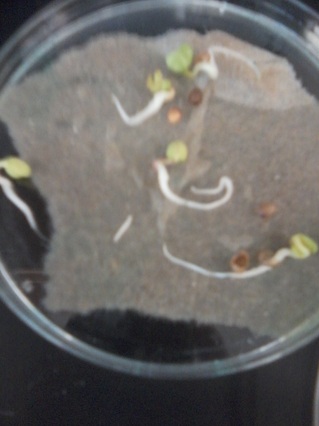
My groups most successful root growth was in the 12.5% salt solution
